Despite the growing amount of free GIS software packages (examples are listed at the end of this little article) most of the people still think about more or less expensive software solutions, provided by a few companies (some of them you will find at the end of this article as well…) and refrain from showing their geo-spatial data. Others may simply not be in the mood or lack the time to learn the handling of new software.
I am sure, most of the people are not aware that it is possible to create simple maps with their existing office programs they already bought or downloaded for free! The following steps show how to create simple maps with spreadsheet programs like MS Excel, LibreOffice Calc or Open Office Calc. In general, the steps are all the same in these programs.
Be aware:
You will not get a tool to manipulate or analyse the shown data. What you will get is a more or less simple map with spatially-related data which you can copy into text documents or presentations. And of course you can add, erase or change data and show them on the map!
An Example:
We want to show world-wide earthquake locations with a magnitude >2.5 which happened within the last seven days. Data you can find e.g. at the USGS website http://earthquake.usgs.gov/earthquakes/catalogs/index.php. Save the CSV data file and open it with Excel or another spreadsheet program.
We can see in our table amongst others the columns Lat and Lon.
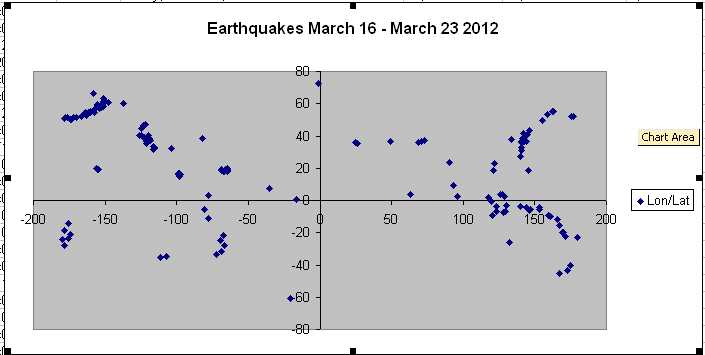
Create now a XY-scatter chart and add a new series, choosing the Lon column for the X values and the Lat column for the Y Values. Finishing the chart wizard we get a chart, which looks like the following figure:
Now we refine the chart changing the scales for the axis (-180 to 180, -90 to 90) for X and Y, respectively. The plot area covers now the grid of a world map.
Each point in the chart represents an earthquake with a specific location.
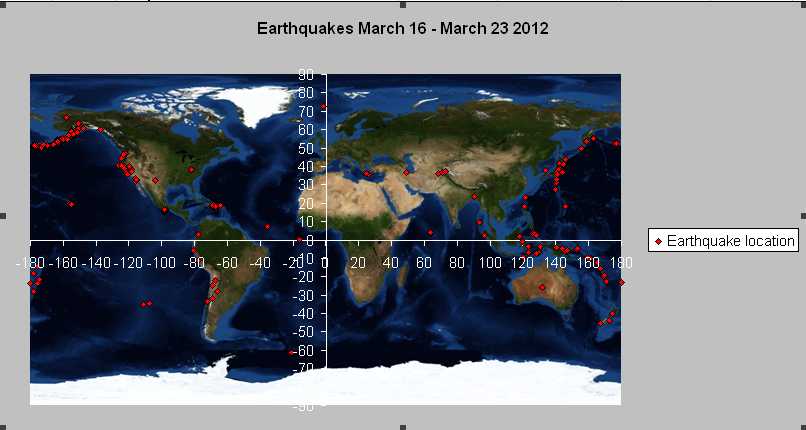
To make things easier to understand, we format the plot area. As fill effect we choose a picture of a world map. You can get nice maps from NASA Visible Earth http://visibleearth.nasa.gov/view_cat.php?categoryID=1484
Having this done, the chart looks similar to this figure.
Now we can clearly see where the earthquakes happened!
This is the simplest way to show spatial related data without using GIS software!
What we need is just a spreadsheet program with basic chart functions and data which provide Lon/Lat in the decimal degree format.
If we want to add a map in the background we need to know the outline and adjust the scale of the axis. In this example, the outline goes from -180.00 to 180.00 for X and -90.00 to 90.00 for Y.
For example you can use this ‚Poor man’s GIS’ if you want to make a presentation of your last hiking trip and show the way on a map. You can import the recorded GPS-tracks and use an OpenStreetMap export as background map.
The example shows a hiking route across Paris recorded with a GPS (The gpx-file got modified to import it easier). The data of the recorded gpx-file create the green line on the map.
Free GIS packages:
QGIS
uDIG
GRASS
gvSIG
(A list of free GIS software can be found here. )
Commercial GIS software:
ESRI ArcGIS
MicroImages TNTMips
MapInfo


