


Excel version:
TriAngle 2.0 Excel
In case of using the template in publications or other texts, please cite the following article:
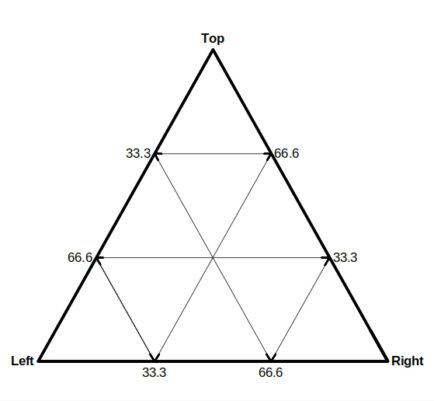
Warnsloh, J.M. (2015) TriAngle: A Microsoft Excel™ spreadsheet template for the generation of triangular plots. N. Jahrb. Miner./J. Min. Geochem., 192, 1, 101-105. DOI: 10.1127/0077-7757/2014/0267
Size: 610KB
Version: 2.0
Published: 15th April 2026
149 Downloads
149 Downloads
since April 15, 2026!LibreOffice version:
TriAngle 2.0 LibreOffice
In case of using the template in publications or other texts, please cite the following article:
Warnsloh, J.M. (2015) TriAngle: A Microsoft Excel™ spreadsheet template for the generation of triangular plots. N. Jahrb. Miner./J. Min. Geochem., 192, 1, 101-105. DOI: 10.1127/0077-7757/2014/0267
Size: 1MB
Version: 2.0
Published: 15th April 2026
80 Downloads
80 Downloads
since April 15, 2026!Older versions:
TriAngle 1.2 Excel.xltx (380 KB, Aug. 24, 2014)
TriAngle 1.2 LibreOffice.ots (315 KB, Dec. 05, 2014)
Helio!!! Not an expert on Excel spreadsheets but do have a question. Would like add additional series beyond Series 10 in the Piper Plot example. It seems to be an extremely complex process. Can you refer me to any examples where additional series have been added with at least some minimal explanation of the process to incorporate the additional data points and get them to plot accurately?
Hello Mark,
thank you for your comment, and apologies for the late reply. To answer your question, I’ve created a post, explaining how to add additional series (beyond Series 10).
Thank you for the information, I really appreciate it!!